To get started on what Power BI is I would like to give you a short introduction about it.
As we all know making decisions by analyzing various sort of data has become vital to many of the large companies. Therefore Power BI is a cloud-based analytical tool which was introduced by Microsoft recently.
Power BI comprises of a desktop application called Power BI Desktop, mobile Power BI app (which is available for Windows, Android and iOS) and an online SaaS called Power BI service. In a nutshell you can generate reports according to the data you input in Power BI desktop then the reports will be published in Power BI SaaS and with Power BI mobile, where the users can view reports you have created. By visiting https://powerbi.microsoft.com/en-us/ you can be aware of everything about Power BI. A significant feature in this tool is that Power BI can integrate with number of services which you use normally like Excel spreadsheets, on-premise data sources, Hadoop datasets, streaming data and cloud services. No matter what position you possess in your organization Power BI is the solution for your data analytical needs, you could handle data regarding Finance, Marketing, Sales, HR, IT and even Operations of your organization.
OKAY let’s start!
After creating an account, log on to the Power BI you will see the following interface.
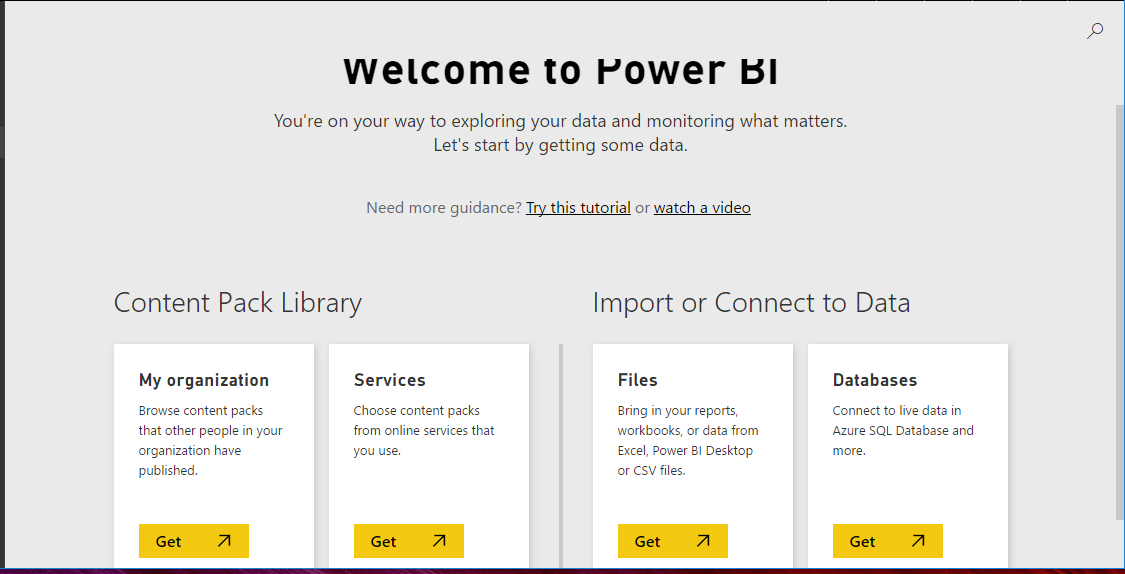
OK there you can see two categories as Content Pack Library and Import or Connect Data. Content Pack consist of pre-configured or ready-made visuals and reports based on specific data sources. Power BI can connect to number of software services so if you need to see what are they what you have to do is click on get button in “Services” cage.
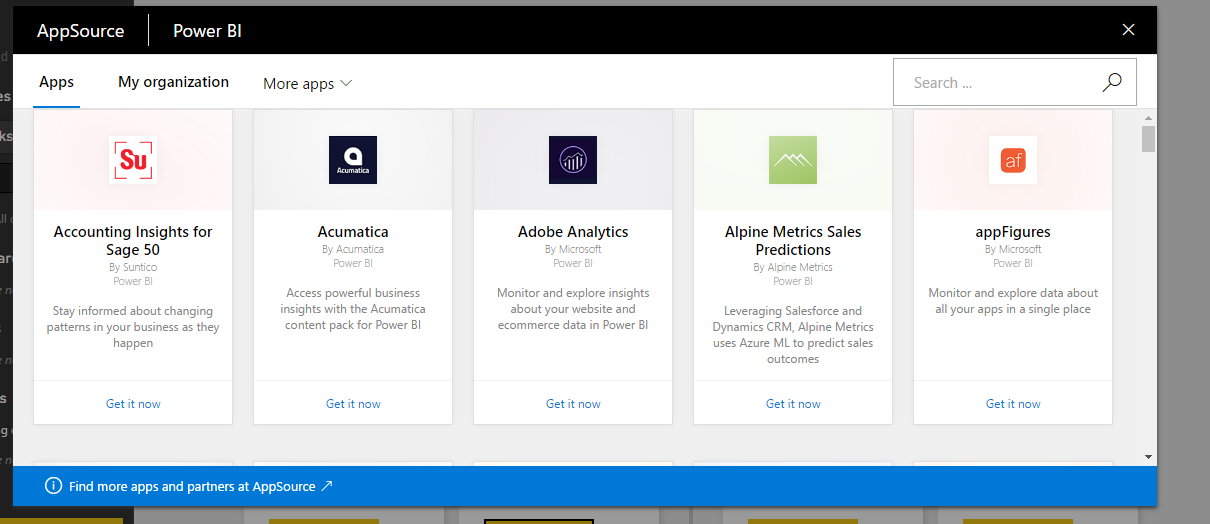
As an example if you need to connect to GitHub, click on GitHub icon in the above interface (in figure 2.0) you will get a pop up as below.
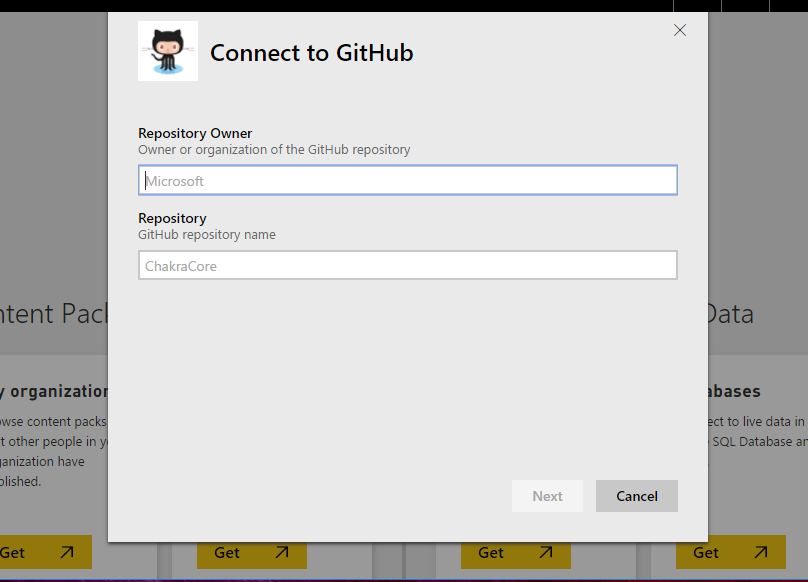
After entering the necessary data you will see box reports, dashboards and analytics regarding your own repository you entered in GitHub.
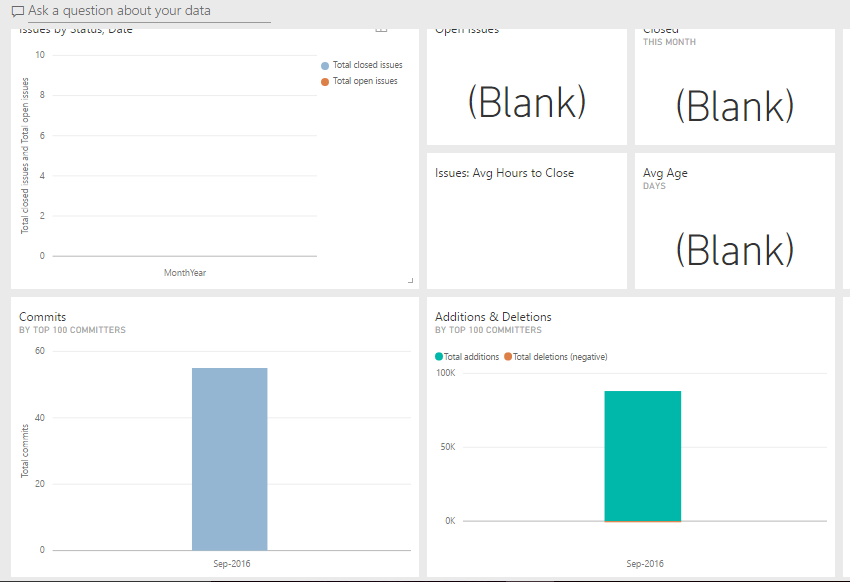
Even you can try this for your own repository and check what happens. By clicking on Reports, Datasets in the dashboard of Power BI service you can view reports and datasets of your repository.
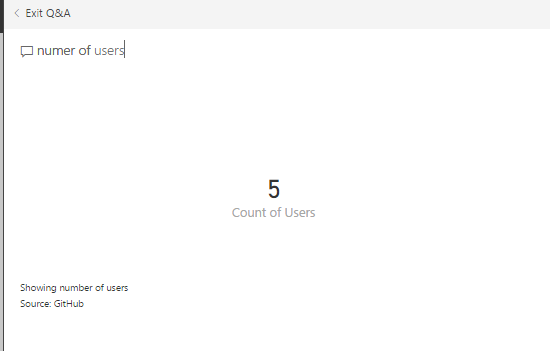
You can clear your doubts by asking questions through Power BI. There’s an example in figure 5.0.
When considering the second category Import or connect to data, there are two cages you (figure 1.0) same as in services. Here you can also input data in different ways; upload a file which is in your local machine, oneDrive or SharePoint. Not just that you can also connect databases through Power BI to create reports, visualizations and datasets by clicking on get data button in “database” cage and choosing appropriate platform.
I think that it’s important to be informed about the flow of the power BI I mentioned earlier.
Power BI desktop
To get Power BI for your desktop what you have to do is go to the arrow depicted in header (figure 6.0) of Power BI site and click on “Power BI desktop”.

Then you can download Power BI and should follow the installation procedure. After installing it in your Windows desktop, when you open Excel, database or whatever services included in Power BI you could see some stuff regarding Power BI. As an example let’s take the easiest one, Excel. You could see an icon called “publish” in toolbar of your Excel sheet.After doing the modifications you need to do you could upload the reports and other visualizations to Power BI SaaS by following the procedure.
Power BI for mobile
You should follow the same procedure to get power BI for your mobile and could view the reports and other necessary things.
Hope you saw Power BI is a great tool for all your data analytical needs. So I hope from now on you would get the maximum benefit from Power BI.
Sources:http://www.getinitsolutions.com/Software-Training-courses-Bangalore.html


