
Modern environments generate telemetry everywhere — Azure, on-premises, edge, Kubernetes, and multicloud. Traditional Azure Monitor ingestion methods often require agents or direct cloud connectivity. This becomes challenging in high-scale, disconnected, or bandwidth-constrained environments.
To address this, Microsoft introduced the Azure Monitor Pipeline, a scalable telemetry ingestion layer that enables collection, transformation, buffering, and routing of monitoring data before sending it to Azure Monitor.
This article explains:
- What Azure Monitor Pipeline is
- Architecture and components
- Data flow and transformations
- Real-world use cases
- When to use Azure Monitor Pipeline
What is Azure Monitor Pipeline
Azure Monitor Pipeline extends Azure Monitor data collection to edge, on-premises, and multicloud environments. It allows telemetry to be collected, processed, cached, and routed before being sent to Azure Monitor.
It acts similar to an ETL (Extract-Transform-Load) ingestion layer that standardizes and scales telemetry collection using a unified pipeline.
Key capabilities:
- High-scale telemetry ingestion
- Local caching during connectivity loss
- Pre-ingestion transformation
- Routing to Azure Monitor
- Bandwidth optimization
- Multi-cloud observability
The pipeline runs as a containerized service deployed on an Arc-enabled Kubernetes cluster in your environment and uses OpenTelemetry Collector internally for ingestion and processing.
Why Azure Monitor Pipeline?
Azure Monitor Pipeline solves several real-world observability challenges:
1. High scale ingestion
Collect telemetry from thousands of servers, devices, or apps without installing agents everywhere.
2. Edge / disconnected environments
Pipeline buffers data locally and syncs when connectivity returns.
3. Bandwidth optimization
Filter and aggregate logs before sending to Azure.
4. Multi-cloud monitoring
Collect telemetry from AWS, GCP, or on-prem and route to Azure Monitor.
5. Agentless collection scenarios
Useful where agents cannot be installed due to compliance or technical limitations.
Azure Monitor Pipeline Architecture
High-level architecture:
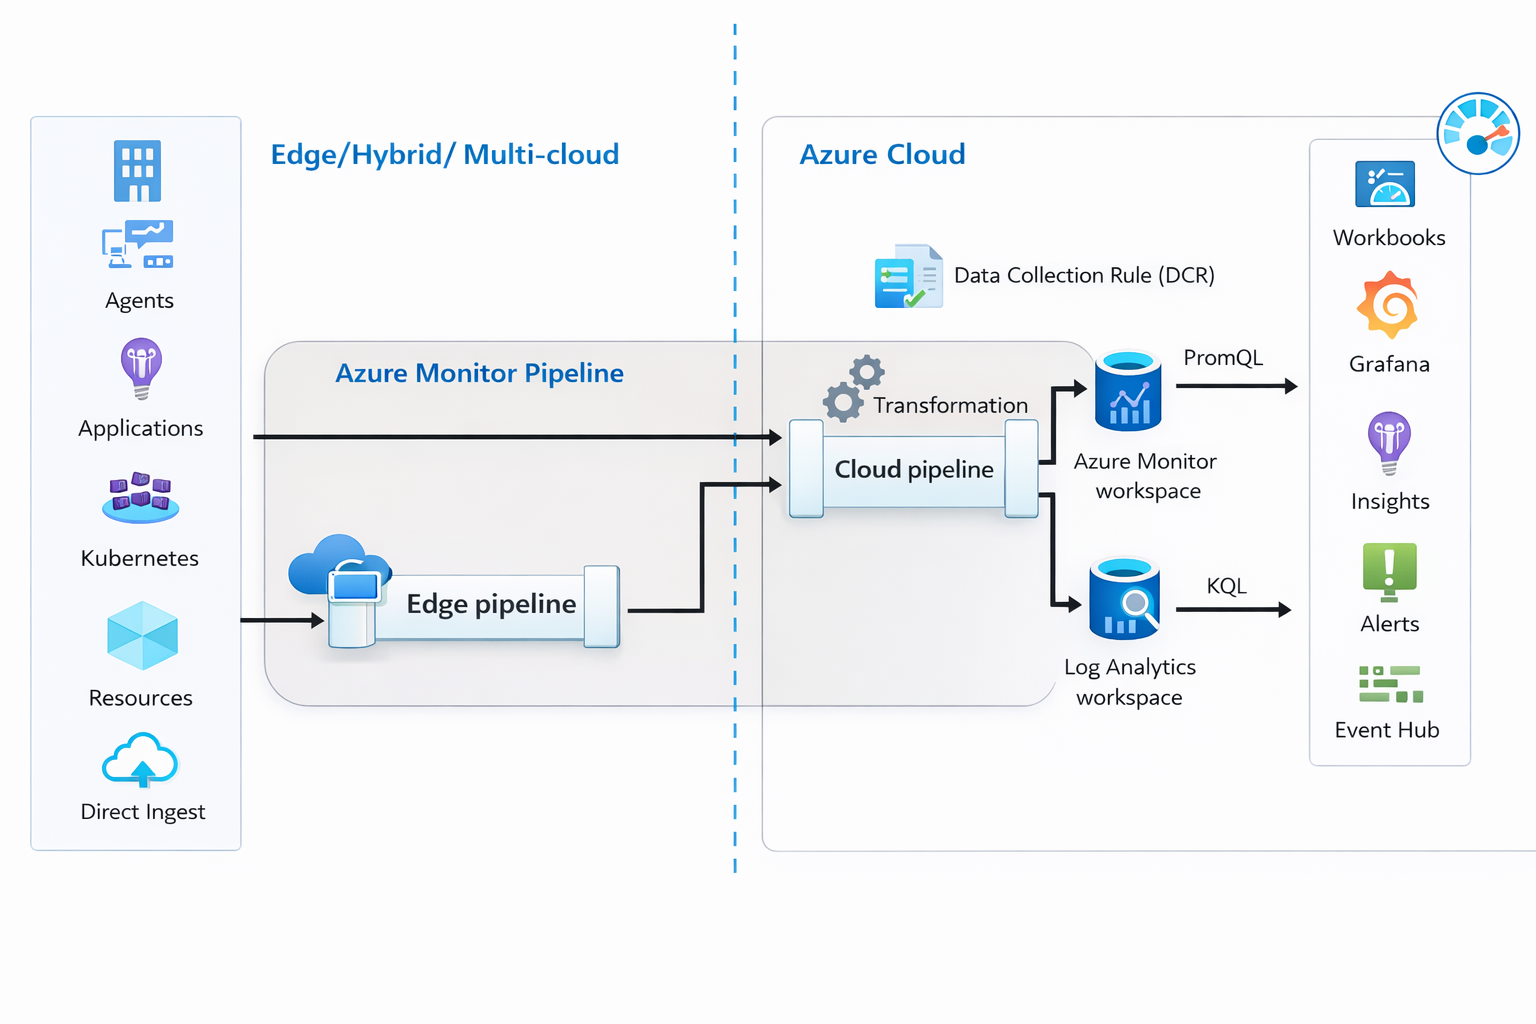
Azure Monitor Pipeline Components
Azure Monitor pipeline consists of the following components:
| Component | Description |
| 1. Pipeline Controller Extension | Extension deployed on Arc-enabled Kubernetes cluster to enable pipeline functionality. |
| 2. Pipeline Controller Instance | Actual running pipeline instance in the cluster. |
| 3. Data Flow | Defines how telemetry moves through the pipeline.
Each data flow contains:
|
| 4. Pipeline Configuration | Defines data flows and routing logic. |
| 5. Data Collection Endpoint (DCE) | Cloud endpoint that receives telemetry. |
| 6. Data Collection Rule (DCR) | Defines:
These components together create a full ingestion pipeline from source to Azure Monitor. |
Data Flow Explained
Step-by-step flow:
| Step | Description |
| Step 1 — Telemetry Generated | From:
|
| Step 2 — Receiver | Pipeline receives telemetry via:
|
| Step 3 — Processor | Transformations applied:
This reduces ingestion cost and improves analytics. |
| Step 4 — Exporter | Data sent to Azure Monitor. |
| Step 5 — DCE + DCR | Azure Monitor processes:
|
| Step 6 — Log Analytics Workspace | Data stored for querying and alerts. |
Supported Telemetry (Preview)
Currently supported:
- Syslog
- OTLP logs
More telemetry types will be added over time.
Data Transformations in Azure Monitor Pipeline
Transformations allow:
- filtering noisy logs
- renaming fields
- schema standardization
- aggregations
- enrichment
Benefits:
- Lower ingestion cost
- Cleaner analytics
- Standardized schema
- Faster queries
Real World Use Cases
| Use Case | Description |
| Use Case 1 – Manufacturing Edge | Factory network isolated from internet:
Devices → Pipeline → Cache → Azure Monitor |
| Use Case 2 — Multi-cloud monitoring | AWS VM GCP VM On-prem servers ↓ Azure Monitor Pipeline ↓ Azure Monitor |
| Use Case 3 — High scale syslog ingestion | 1000 network devices ↓ Pipeline ↓ Log Analytics |
| Use Case 4 — Bandwidth optimization | Filter logs locally before ingestion. |
Azure Monitor Pipeline vs Azure Monitor Agent
| Feature | Azure Monitor Agent | Azure Monitor Pipeline |
|---|---|---|
| Agent required | Yes | No |
| Edge support | Limited | Yes |
| Transform before ingestion | Limited | Yes |
| Local caching | No | Yes |
| High scale ingestion | Limited | Yes |
| Multi-cloud | Limited | Yes |
When Should You Use Azure Monitor Pipeline
Use Azure Monitor Pipeline when:
- Large scale environments
- Edge deployments
- Disconnected environments
- Multi-cloud observability
- Centralized log ingestion
- Reduce ingestion cost
- Agentless collection required
Final Thoughts
Azure Monitor Pipeline is a major evolution in Azure observability architecture. Instead of sending telemetry directly to Azure Monitor, organizations can now build a smart ingestion layer that filters, transforms, buffers, and routes telemetry efficiently.
This is especially powerful for:
- Enterprise observability platforms
- Edge computing environments
- Hybrid deployments
- Large scale logging scenarios
Azure Monitor Pipeline essentially brings modern observability pipeline architecture into Azure Monitor.
")


")
